Tags: CSS Firefox Internet Explorer (IE)
Those involved in designing web pages have faced a lot of difficulties managing different rendering engines, namely found in Firefox and Internet Explorer, the two most used browsers according to some published researches.
A service was started over three years is being still offered in a new application. All you have to do is to sign up to create your new account, and start testing your code.
as you can see, most of the A+ Browsers are supported, and you wont have to worry about CSS compatibility anymore.
Start here: http://litmusapp.com/browser-testing
Followers
Monday, January 26, 2009
Saturday, January 24, 2009
FastCGI Extension by Microsoft to run PHP on IIS
TAGs: IIS, FastCGI, PHP
Microsoft has recently made FastCGI Extension available for download from its downloads site, that will enable IIS to run scripting languages other than asp.net, for example PHP.
As described by Microsoft
Microsoft has recently made FastCGI Extension available for download from its downloads site, that will enable IIS to run scripting languages other than asp.net, for example PHP.
As described by Microsoft
An important note for running FastCGI, that IIS 6.0 or 5.1 must be enabled on the operating system in order to be able to use FastCGI Extension. There is another FastCGI extension to make APACHE handle the desiered file extensions by FastCGI.Brief Description
The FastCGI Extension for Internet Information Services (IIS) 6.0 and 5.1 enables popular application frameworks (such as PHP) to be hosted on the IIS web server in a high-performance and reliable way.
The FastCGI Extension for IIS 6.0 and 5.1 enables popular application frameworks that support FastCGI protocol to be hosted on the IIS web server in a high-performance and reliable way. FastCGI provides a high-performance alternative to the Common Gateway Interface (CGI), a standard way of interfacing external applications with Web servers that has been supported as part of the IIS feature-set since the very first release.
CGI programs are executables launched by the web server for each request in order to process the request and generate dynamic responses that are sent back to the client. Because many of these frameworks do not support multi-threaded execution, CGI enables them to execute reliably on IIS by executing exactly one request per process. Unfortunately, it provides poor performance due to the high cost of starting and shutting down a process for each request.
FastCGI addresses the performance issues inherent to CGI by providing a mechanism to reuse a single process over and over again for many requests. Additionally, FastCGI maintains compatibility with non-thread-safe libraries by providing a pool of reusable processes and ensuring that each process will only handle one request at a time.
Tuesday, January 20, 2009
HOWTO: Using xdebug and PHPEclipse for PHP debugging on Windows
TAGS: php xdebug phpeclipse
After struggling for a while to get the ability of debugging PHP scripts, reading here and there on xdebug wiki, and other php developers websites, I finally managed to assemble the needed information into this HOWTO which I hope is going to help someone to setup the proper environment for using PHPEclipse and xdebug to debug PHP scripts.
To debug using xdebug extension and PHPEclipse editor on windows (vista or other versions should equally the same) there are two main steps:
A- Installation of xdebug.
B- Preparing PHPEclipse.
Follow the steps exactly as explained and you will be safe.
= = = = = = = = = = = = = = =
A- Installation of xdebug:
If you are familiar with php extensions, just download the xdebug extension and modify php.ini to load it as a zend extension, and skip reading to section B.
In details, follow these five steps:
1- Download the xdebug http://www.xdebug.org/download.php.
make sure to select the proper version matching the server threaded mode.
I am using WampManager 2.0 ( which is bundled with PHP5, MySQL, Apache 2.x)
2- Extract the dll file and put in the ext folder of your PHP.
(in my case, c:\wamp\bin\php\php5.2.5\ext\php_xdebug.dll , match your php version and path)
3- Open php.ini and put these lines at the end of the file
(remember, the path must match your php installation path)
NOTE:
extension=php_xdebug.dll
to load xdebug as an extension instead of a zend_extension was not helpful! I tried it and wasted time trying to make it work, avoid it unless you know what you are doing.
4- Restart Apache.
With WampManager, it is as easy as a click on the WampManager Icon and choosing Restart All Services.
5- After Apache restarts, open the phpinfo page to check out xdebug is loaded properly.
if you dont have a phpinfo page, just create a new phpinfo.php file as follows:
If the dll was inserted in the correct path, and the php.ini was updated correctly, then you will see the following:
If you can not see that line, go over the steps.
1- Check your Apache version.
2- Check your PHP version.
3- Check the dll name (that it has no version number, only php_xdebug.dll).
4- Download the correct xdebug version if needed and repeat the above steps.
= = = = = = = = = = = = = = = = = = = = = = = = = = = = = =
B- Using xdebug in PHPEclipse
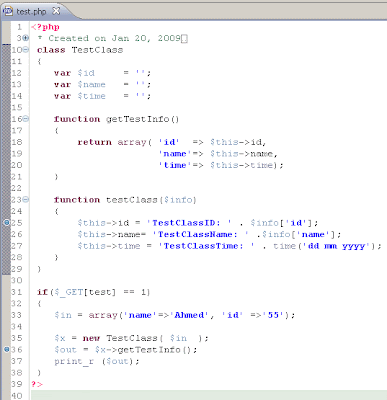
1- Create a script you want to debug.
2- Create brake points by a Double Click on the line margin, or right click -> Toggle Breakpoint.
You will notice small blue dot at each breakpoint location.
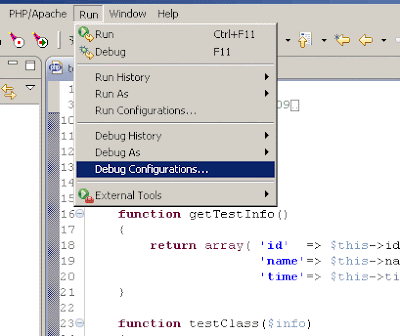
3- Open Debug Configurations ( in Run menu).
4- Double Click the PHP Debug Remote Script option.
5- Specify the IDE identification string , for example: testID.
(it is the ID we will use to start debugging later on, important to choose something easy to retype).
The project name is filled automatically, and you can type the folder name which the script will be saved it, if you have not created a project already.
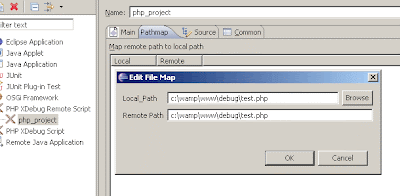
6- Click on PATHMAP tab.
7- Click on NEW and type the path to your script.
8- Click Debug button.
(the window will close and you will be taken back to the PHP editor).
9- Click on Debug Perspective Button (found on the top right corner, if not, window -> show perspective -> debug).
the perspective will be empty but of the original code.
10- Point your browser to the test.php script
in my case, http://localhost/debug/test.php
So far, no debugging session has started, check the PHPEclipse:
but once you click on debug, which passes
Stepping in / out is possible by clicking the yellow arrows in the Debug perspective.
That's it. Enjoy :)
= = = = = = = = = = = = = = = = = = = = = = = = = = = = = =
After struggling for a while to get the ability of debugging PHP scripts, reading here and there on xdebug wiki, and other php developers websites, I finally managed to assemble the needed information into this HOWTO which I hope is going to help someone to setup the proper environment for using PHPEclipse and xdebug to debug PHP scripts.
To debug using xdebug extension and PHPEclipse editor on windows (vista or other versions should equally the same) there are two main steps:
A- Installation of xdebug.
B- Preparing PHPEclipse.
Follow the steps exactly as explained and you will be safe.
= = = = = = = = = = = = = = =
A- Installation of xdebug:
If you are familiar with php extensions, just download the xdebug extension and modify php.ini to load it as a zend extension, and skip reading to section B.
In details, follow these five steps:
1- Download the xdebug http://www.xdebug.org/download.php.
make sure to select the proper version matching the server threaded mode.
I am using WampManager 2.0 ( which is bundled with PHP5, MySQL, Apache 2.x)
2- Extract the dll file and put in the ext folder of your PHP.
(in my case, c:\wamp\bin\php\php5.2.5\ext\php_xdebug.dll , match your php version and path)
3- Open php.ini and put these lines at the end of the file
zend_extension_ts = "C:\wamp\bin\php\php5.2.5\ext\php_xdebug.dll"
xdebug.remote_enable=1
(remember, the path must match your php installation path)
NOTE:
extension=php_xdebug.dll
to load xdebug as an extension instead of a zend_extension was not helpful! I tried it and wasted time trying to make it work, avoid it unless you know what you are doing.
4- Restart Apache.
With WampManager, it is as easy as a click on the WampManager Icon and choosing Restart All Services.
5- After Apache restarts, open the phpinfo page to check out xdebug is loaded properly.
if you dont have a phpinfo page, just create a new phpinfo.php file as follows:
If the dll was inserted in the correct path, and the php.ini was updated correctly, then you will see the following:
This program makes use of the Zend Scripting Language Engine:
Zend Engine v2.2.0, Copyright (c) 1998-2007 Zend Technologies
with eAccelerator v0.9.5.3, Copyright (c) 2004-2006 eAccelerator, by eAccelerator
with Xdebug v2.0.4, Copyright (c) 2002-2008, by Derick Rethans
If you can not see that line, go over the steps.
1- Check your Apache version.
2- Check your PHP version.
3- Check the dll name (that it has no version number, only php_xdebug.dll).
4- Download the correct xdebug version if needed and repeat the above steps.
= = = = = = = = = = = = = = = = = = = = = = = = = = = = = =
B- Using xdebug in PHPEclipse
1- Create a script you want to debug.
2- Create brake points by a Double Click on the line margin, or right click -> Toggle Breakpoint.
You will notice small blue dot at each breakpoint location.
3- Open Debug Configurations ( in Run menu).
4- Double Click the PHP Debug Remote Script option.
5- Specify the IDE identification string , for example: testID.
(it is the ID we will use to start debugging later on, important to choose something easy to retype).
The project name is filled automatically, and you can type the folder name which the script will be saved it, if you have not created a project already.
6- Click on PATHMAP tab.
7- Click on NEW and type the path to your script.
8- Click Debug button.
(the window will close and you will be taken back to the PHP editor).
9- Click on Debug Perspective Button (found on the top right corner, if not, window -> show perspective -> debug).
the perspective will be empty but of the original code.
10- Point your browser to the test.php script
in my case, http://localhost/debug/test.php
So far, no debugging session has started, check the PHPEclipse:
but once you click on debug, which passes
?XDEBUG_SESSION_START=testID&test=1the debug session will start. You will notice the perspective windows in PHPEclipse starting to populate with debug info and variable values.
Stepping in / out is possible by clicking the yellow arrows in the Debug perspective.
That's it. Enjoy :)
= = = = = = = = = = = = = = = = = = = = = = = = = = = = = =
Saturday, January 10, 2009
Yahoo! Media Player Widget
A nice release from Yahoo!
http://mediaplayer.yahoo.com/
Yahoo released a new widget which allows any web owner to play media (sound or video) files with a simple link to include the media player into any webpage, and giving full control over the player.
Pros:
- Lay web users would be able to embed media easily.
- Nice slim player that can be hidden once unneeded.
Cons:
- XSS / CSRF exploits.
- Floating Player does not continue playing if a link is clicked.
Subscribe to:
Posts (Atom)
About Me
- حسين أحمد
- Chicago, IL, United States
- Creativity enthusiast ... Worked as web based application developer for more than 10 years using cgi, asp, php, asp.net server scripting languages in addition to JavaScript and recently glowing frameworks such as prototype, scriptaculous, jquery, mootools.. working on enhancing managerial skills and looking forward for a good position ;)